Expanding the frontiers of cool-dwarf asteroseismology with ESPRESSO
The question
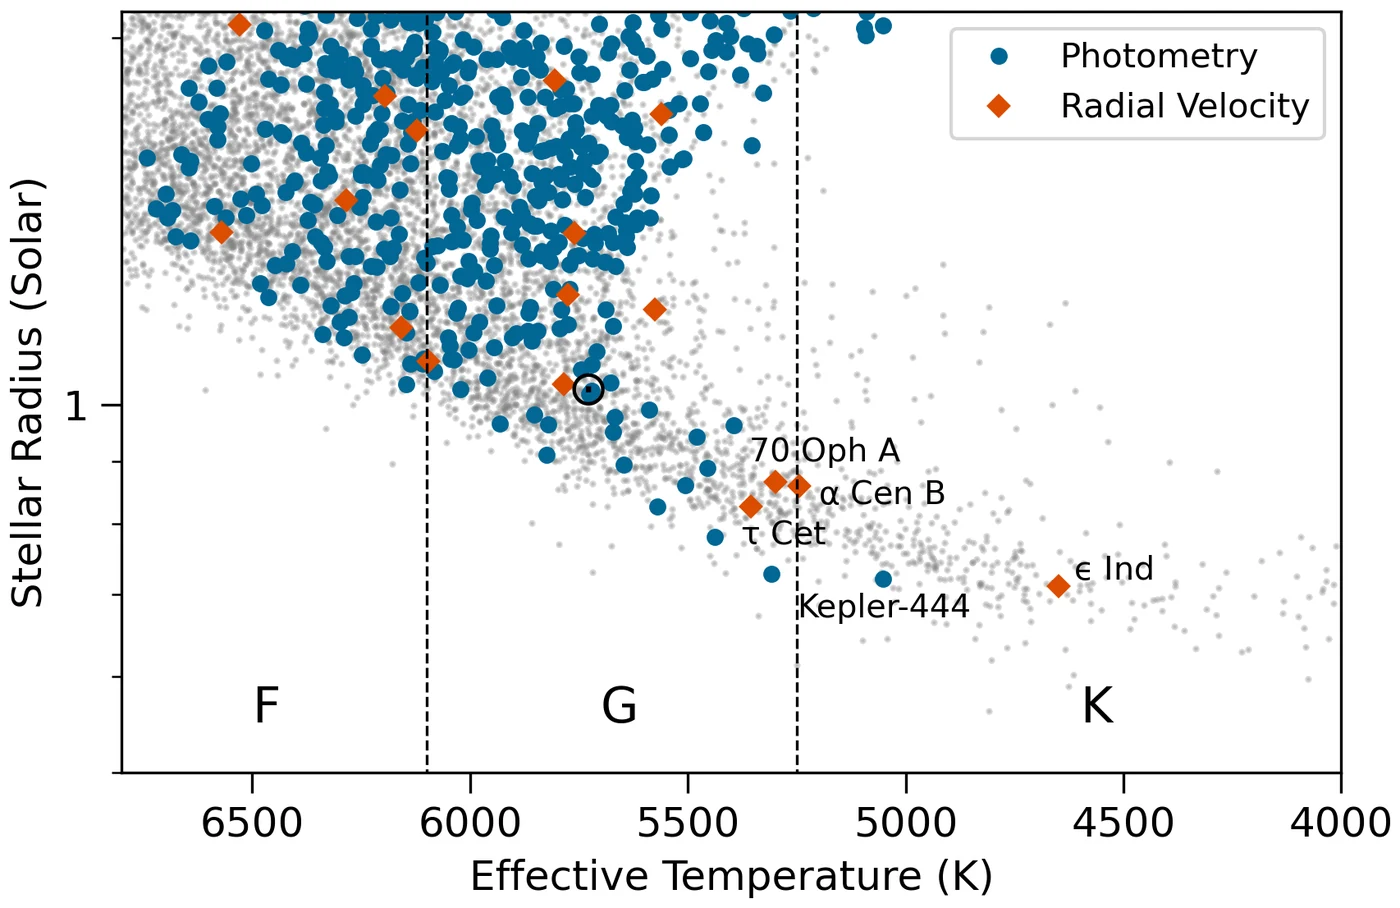
Stars like the Sun vibrate with sound waves, and the tones reveal their mass, radius and age. K dwarfs, smaller and cooler than the Sun, vibrate so weakly that no dwarf cooler than about 5000 K had shown oscillations before this letter (Sect. 1, Fig. 1). These stars are a focus of searches for potentially habitable planets, and because they are common and long-lived they also record the Milky Way's chemical history (Sect. 1).
What the team did
The team watched the surface of ε Indi move towards and away from Earth. ESPRESSO on ESO's Very Large Telescope observed this K dwarf, 3.6 parsecs (12 light years) away, for six half nights in September 2022, taking 2084 exposures of 25 seconds each (Sect. 2). The team also re-analysed 2018 ESPRESSO data of HD 40307, a fainter K dwarf with a tentative earlier claim of oscillations (Sect. 1, Appendix D).
What came out
ε Indi oscillates with periods of about three minutes. The team measured 19 oscillation modes (individual tones), centred near 5.3 mHz (Sects. 3.1 and 3.2, Fig. 3). At 4649 K, the star was cooler than any other dwarf with measured oscillations at the time (Sect. 2, Fig. 1).
Its oscillations are weak. The peak amplitude, 2.6 ± 0.5 cm/s, is about 14 per cent of the Sun's and about half what the usual scaling predicts. Below about 5500 K the data favour a steeper scaling, close to (L/M)1.5, with L/M the ratio of luminosity to mass (Sects. 3.3 and 4, Fig. 5).
My part
I ran the statistical test of whether the HD 40307 data contain oscillations, the Bayes-factor test in Appendix D. A Bayes factor compares how well two models explain the same data: here, a power spectrum with a hump of oscillation power against one without. The test gave ln B < −2 for every assumed hump position from 3 to 6 mHz, strong evidence against a detection, so the letter plots HD 40307 as an upper limit of 4.93 cm/s (Fig. 5).