Gaia
A turntable of the spacecraft, modelled from ESA's published descriptions of its sunshield, service module and payload.
I made these renders, figures and dashboards for my research, my software and this site.
Where a picture shows data, the data are real measurements, and the script behind each render states which parts are schematic. I compared the spacecraft part by part with flight photographs and agency images. Hover or tap a piece for its title and a line about it.
Gaia, Kepler and TESS supply data for my work, and I contribute to PLATO and Ariel. TESS is built on NASA's official base mesh, and I built Kepler to the dimensions of NASA's mesh, 4.7 m high. I found no official model of PLATO or Ariel, so both are schematics from public ESA material, as is Gaia.
A turntable of the spacecraft, modelled from ESA's published descriptions of its sunshield, service module and payload.
Built to ESA's published figures: 26 cameras in four groups of six and two fast, on a bench about 9 m across.
I built Kepler to the dimensions of NASA's mesh, 4.7 m high, with copper insulation matched to a flight photograph.
Built from ESA images with three V-groove shells and an elliptical primary of 1.1 by 0.7 m.
Built from NASA's official model at its 3.9 m span, with cell colour matched to flight photographs.
The oscillations of one red giant sit at one end of this section and a map of 160,000 Gaia DR3 giants at the other. The power spectrum is that of KIC 6144777 from twelve quarters of Kepler data, and colour in the sky map marks metallicity. The cluster in the line-of-sight drawing is schematic.
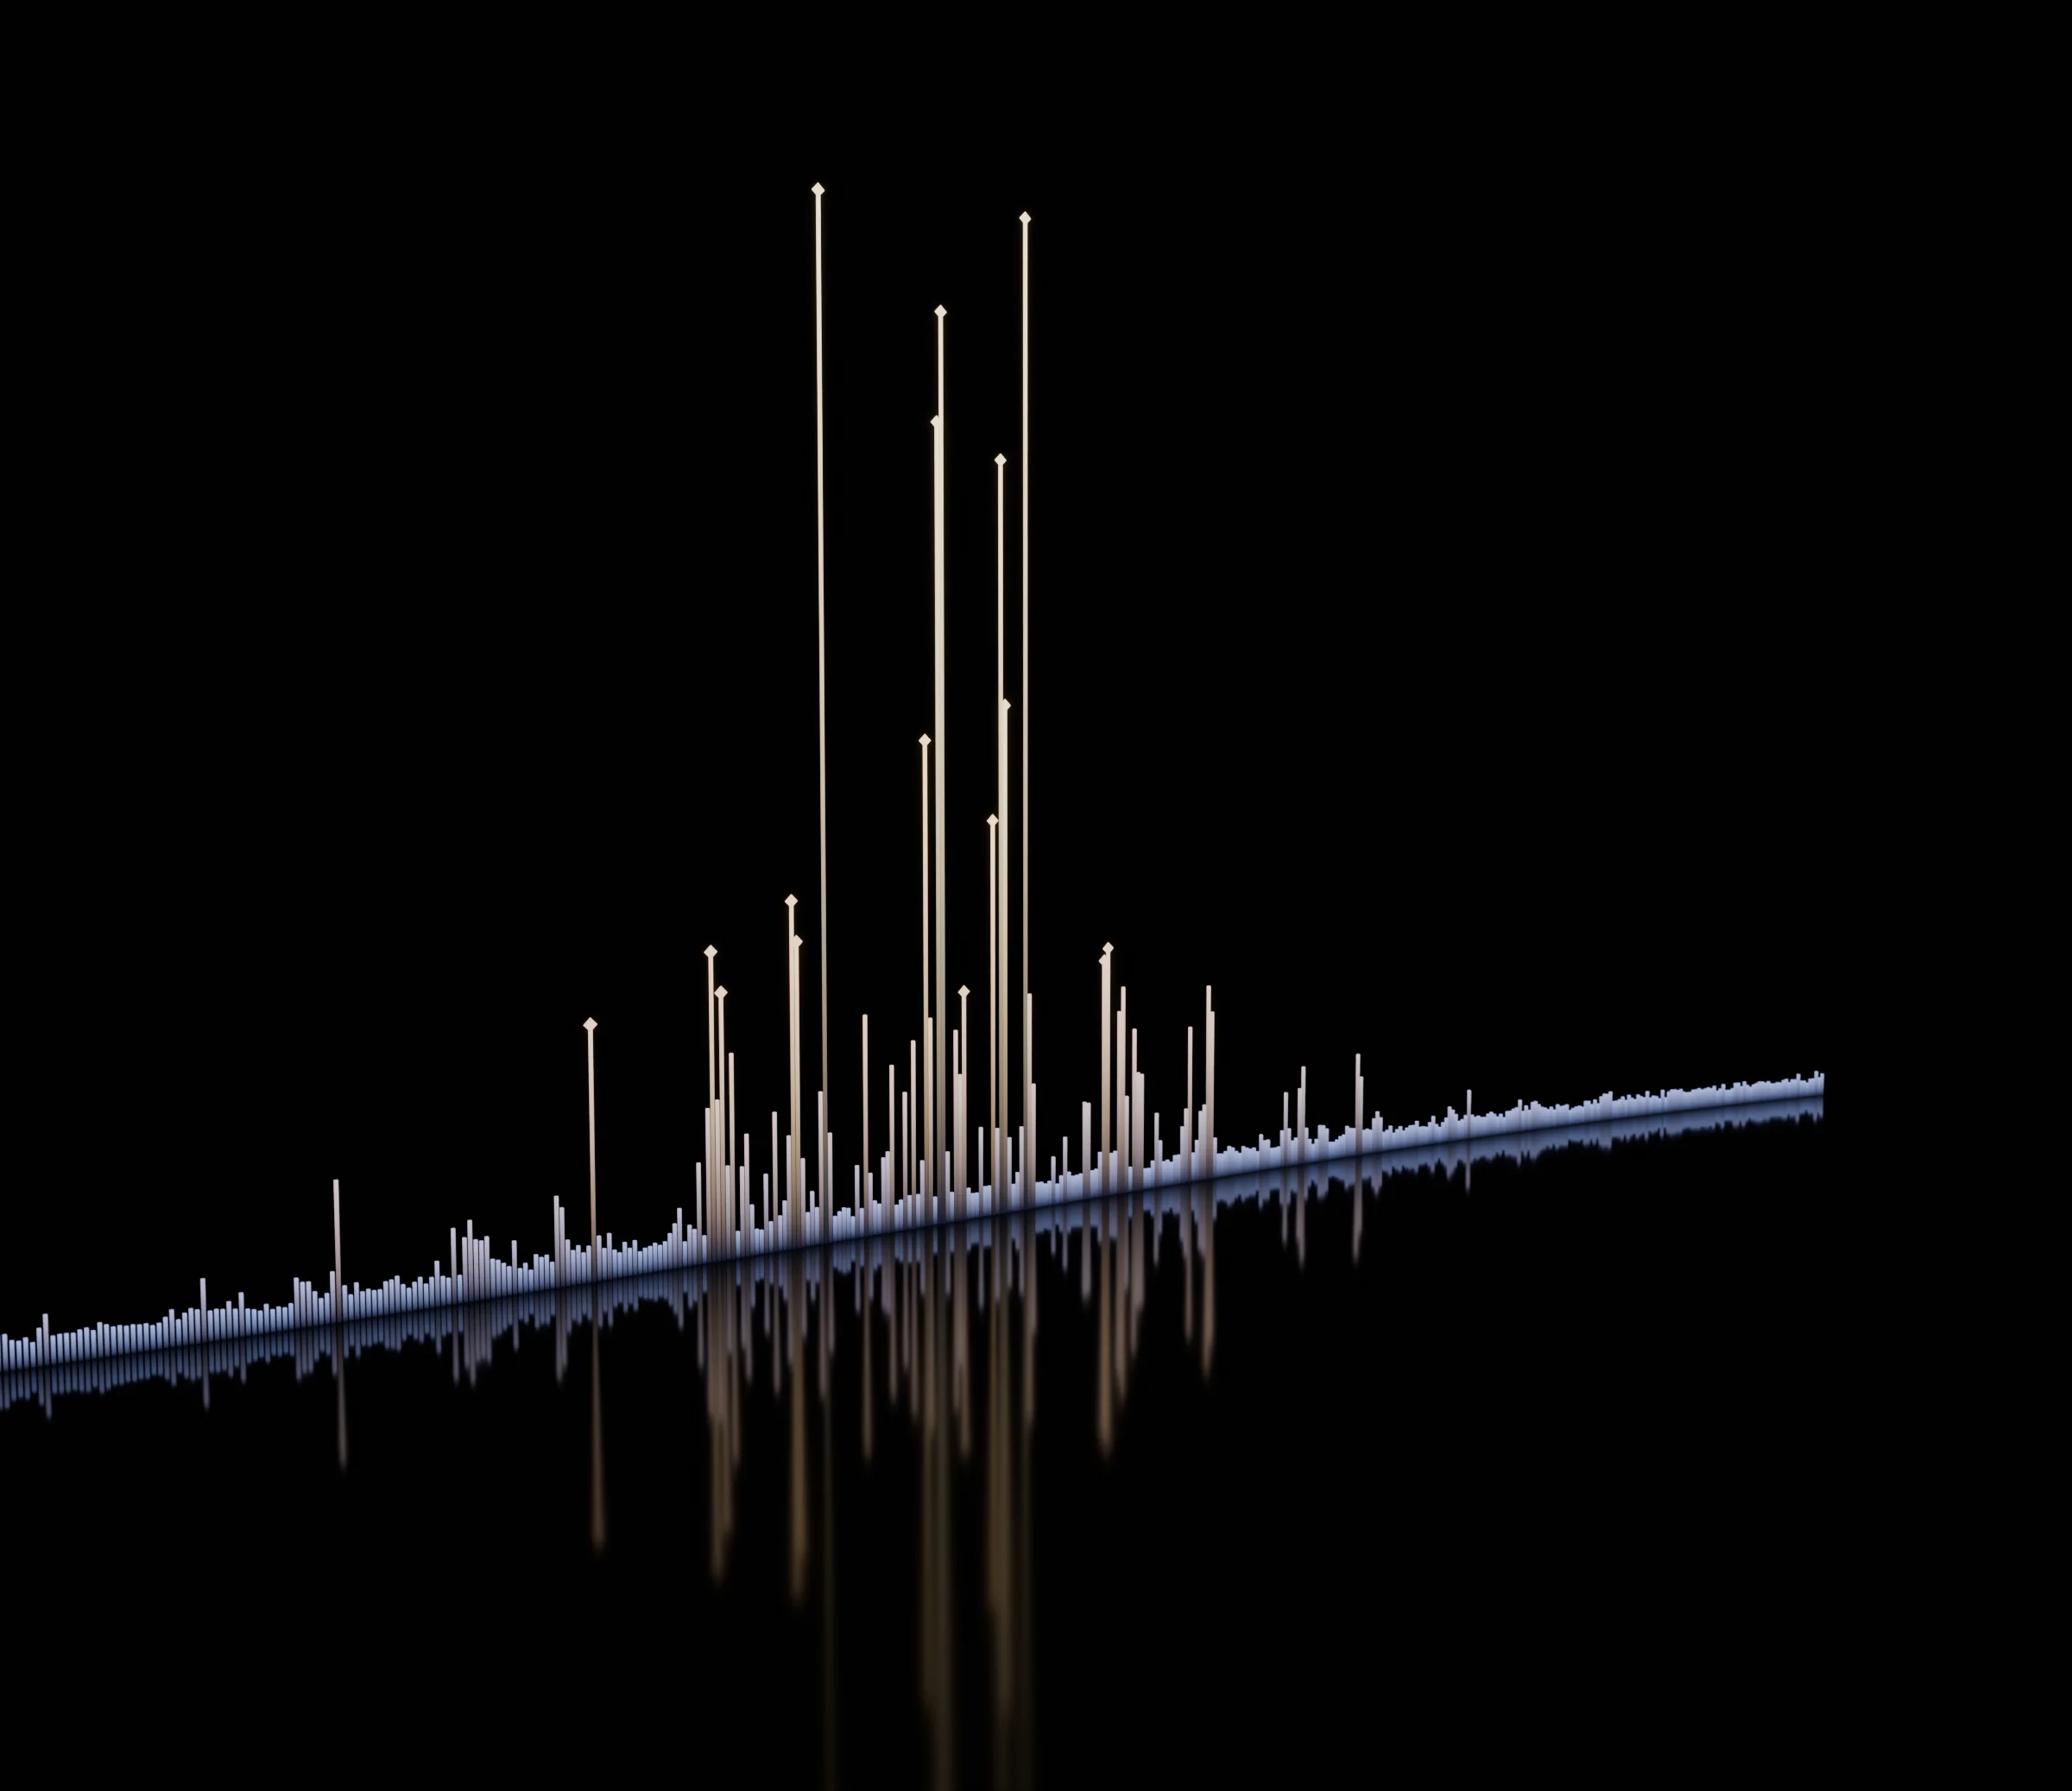
The Kepler power spectrum of KIC 6144777 from twelve quarters of data, drawn as filaments with its shape unchanged.
One loop takes Kepler and Gaia data through JANUS and Starfold to the Milky Way, drawn from the real measurements.
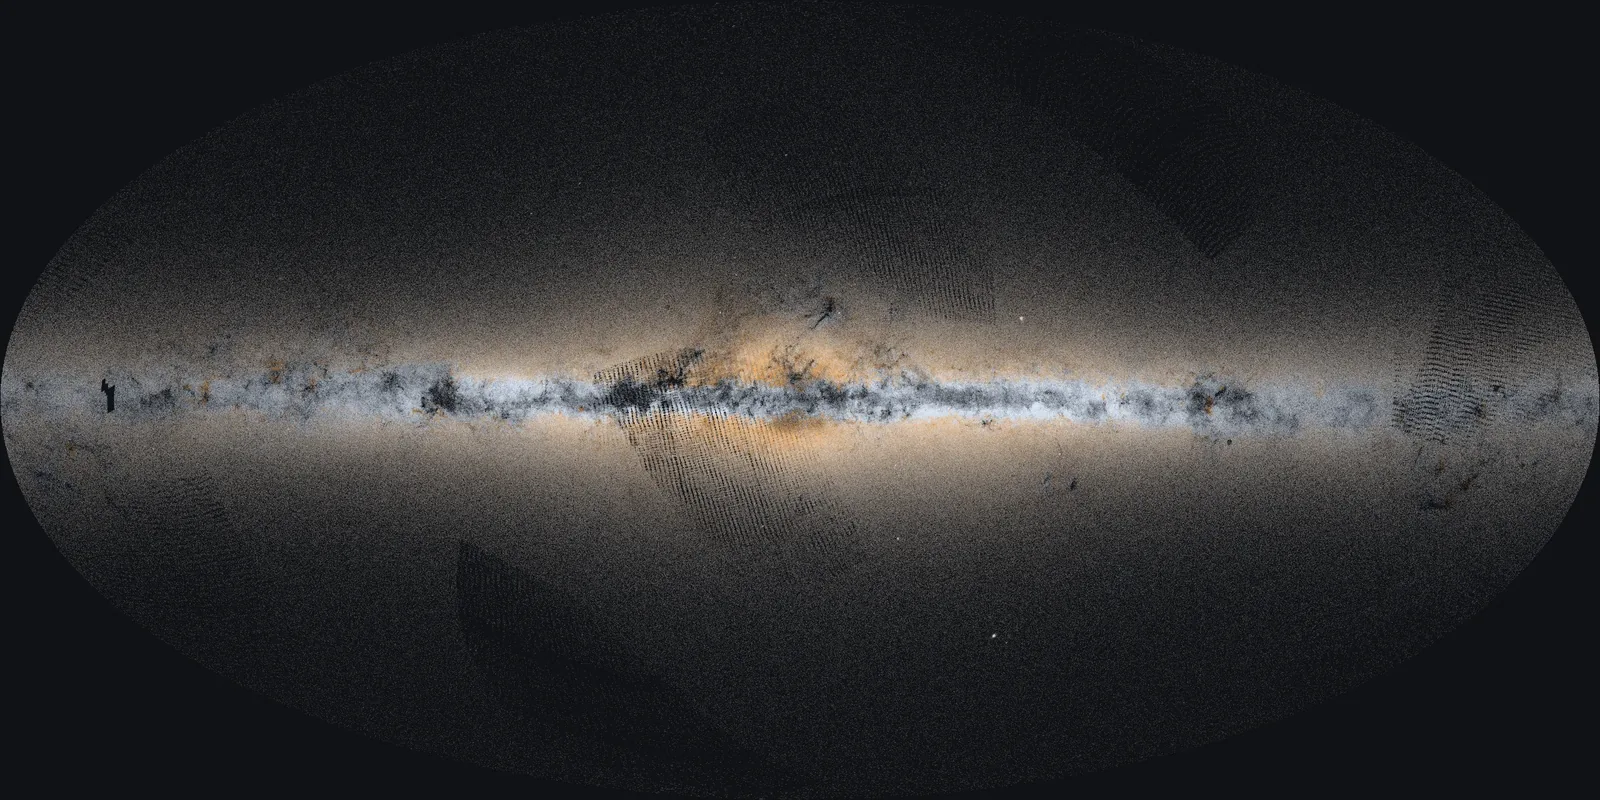
160,000 Gaia DR3 giants from Andrae et al. 2023, with colour marking metallicity from Ardern-Arentsen et al. 2025.
The Milky Way rising over the hills at Paranal, drawn from Gaia red giants.
An isometric drawing generated by script that shows how neighbouring stars add light to a target's pixel mask.
Starfold and JANUS account for three of the four pieces here. The dashboard shows 9,242 stars of the real APOGEE run, and the unrolled map 4,000 of them. The JANUS picture starts from a real Gaia XP spectrum, and its later layers are schematic. The machine hall is a schematic of the kind of hall that houses Deucalion and MareNostrum 5.
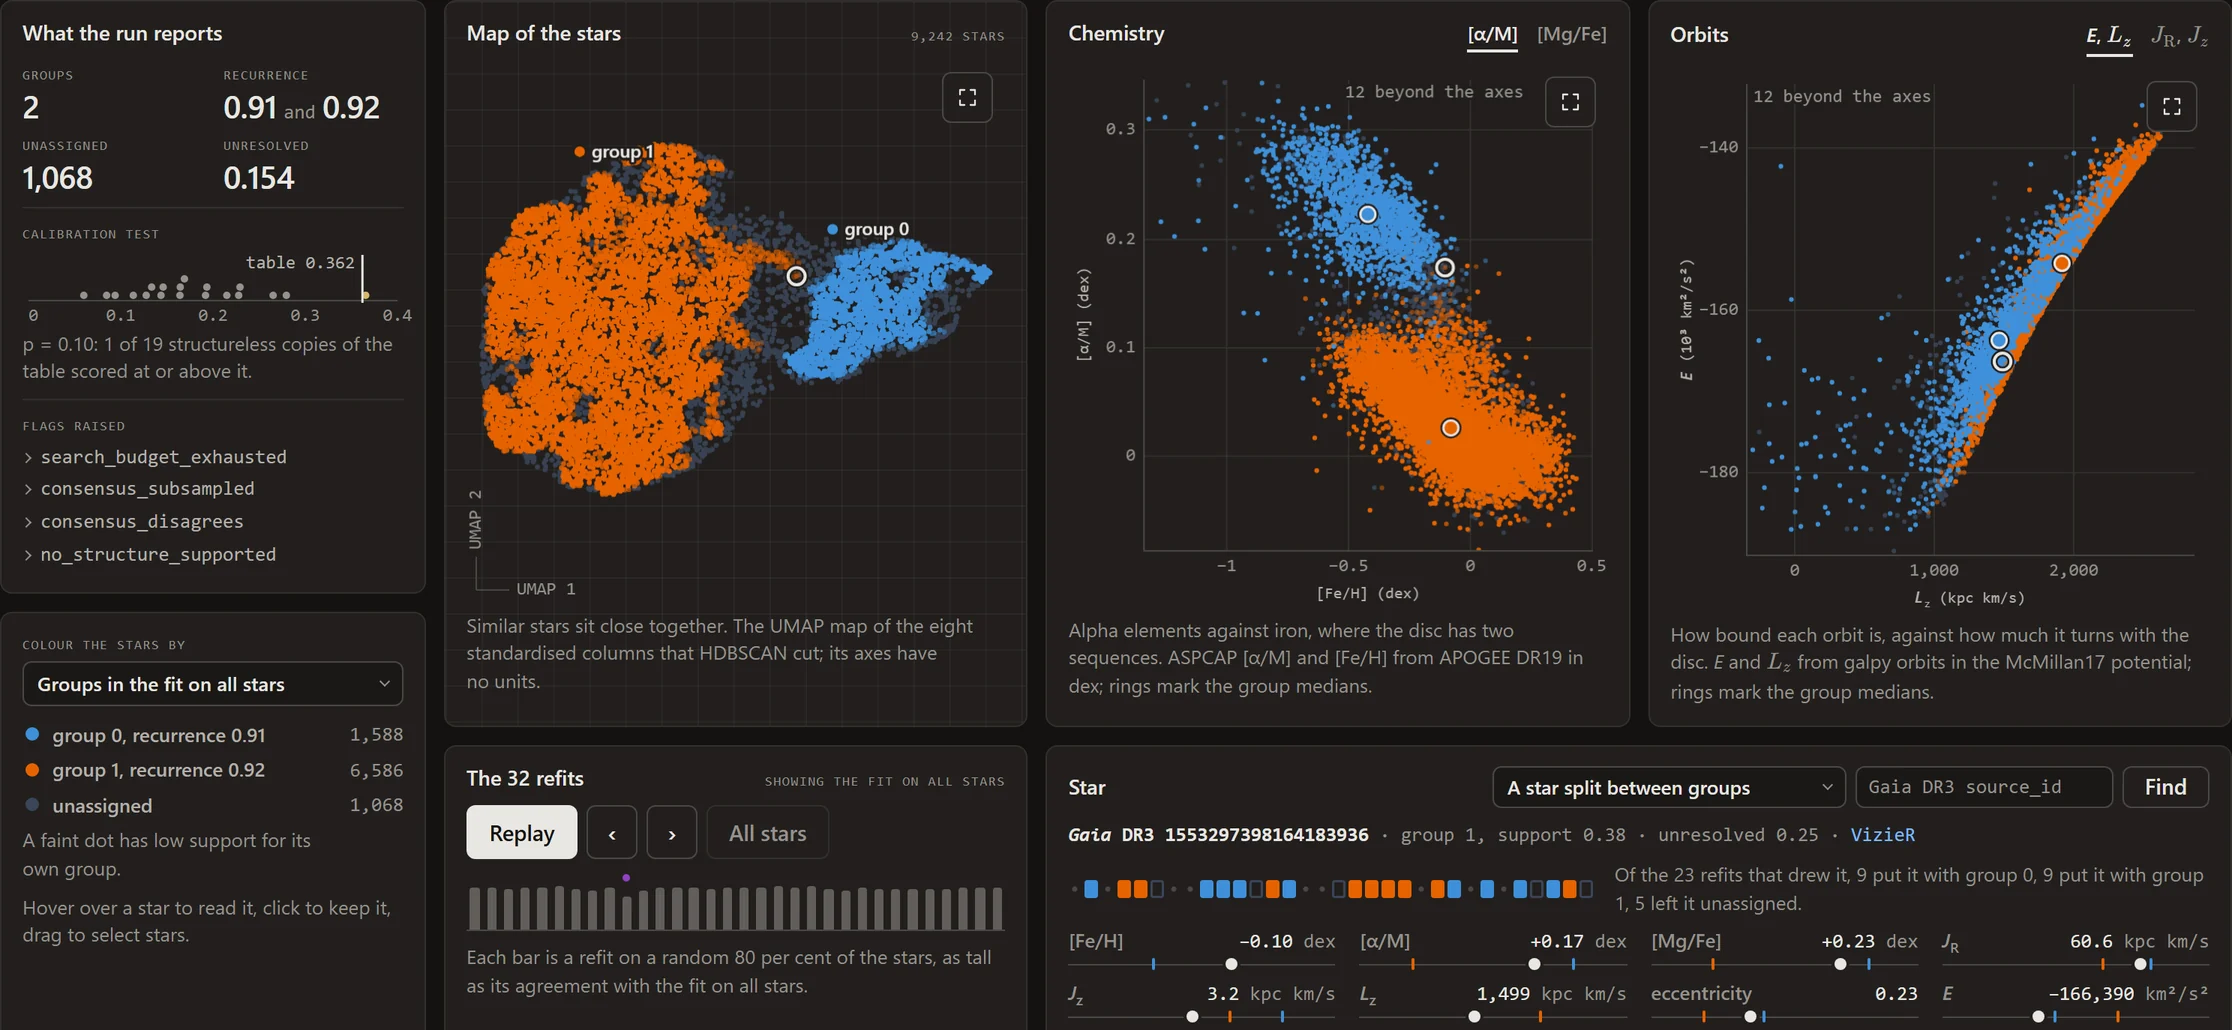
Linked panels for 9,242 APOGEE DR19 stars: select on the map and the chemistry, orbits and refits follow.
A schematic of the kind of hall that houses Deucalion and MareNostrum 5, with racks, raised floor and cable trays.
4,000 real stars of the run leave the chemistry plane, settle on a rolled sheet and unroll into the map with its two groups.
A real Gaia XP spectrum of a red giant passes through a network, and the network is drawn as a schematic.
Stellar Explorer runs in the browser, decodes its data file there and uploads nothing. The four playgrounds rebuild methods from my coursework and research on real data. Tellurion is a public beta of physics and astronomy simulations, and the globe draws my research travel from Porto.
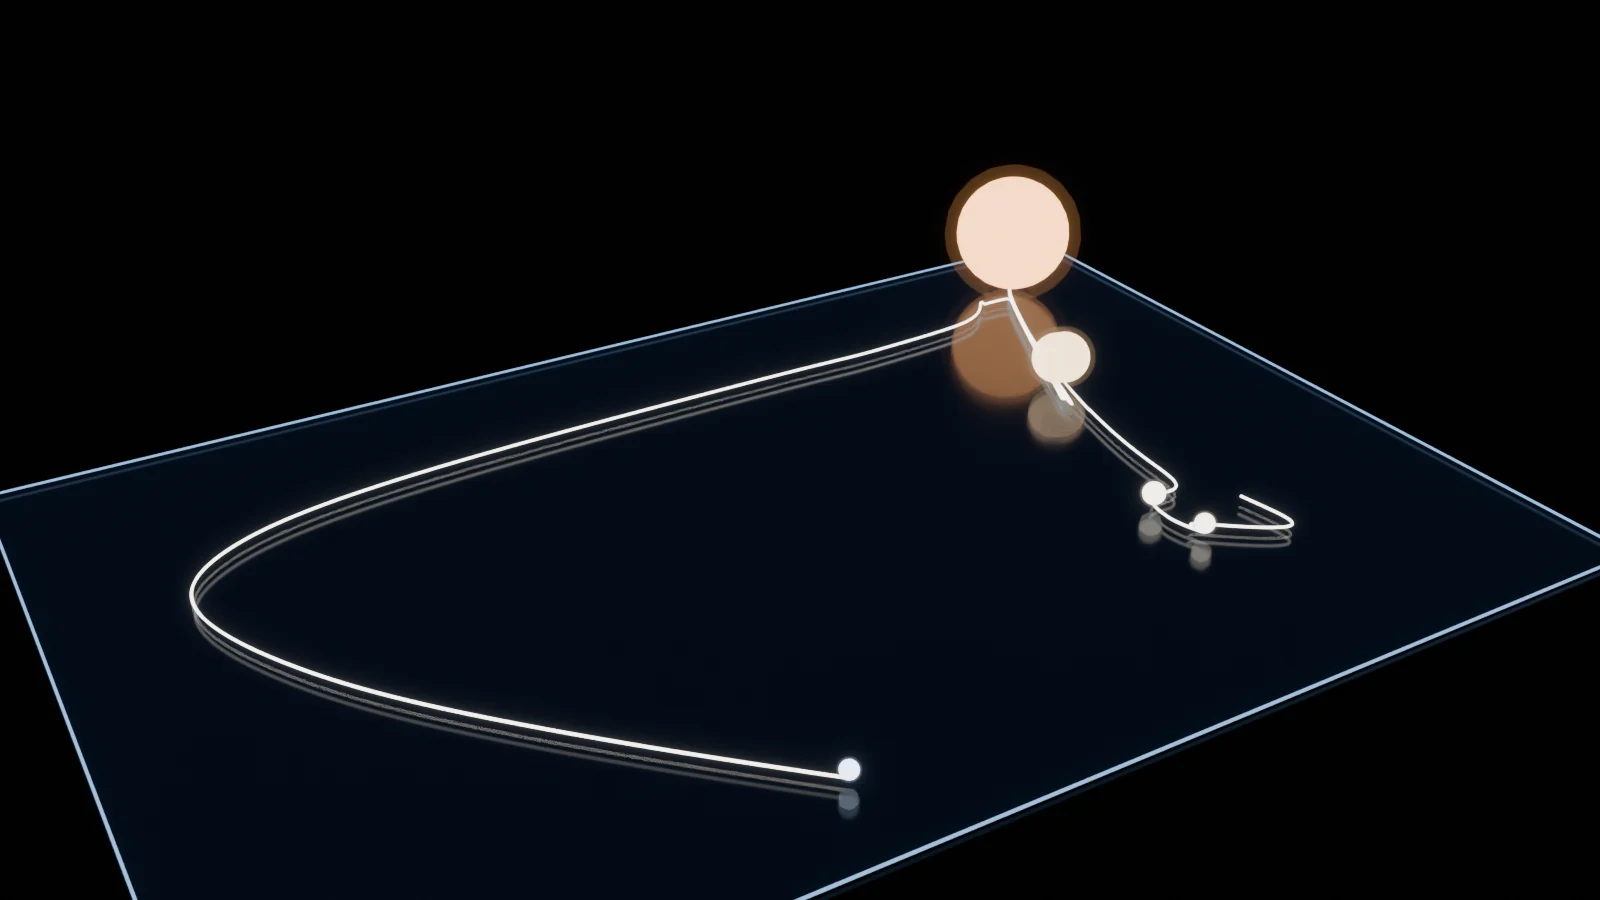
Follows a star of one solar mass from contraction to white dwarf, using 94 models with their own interiors.
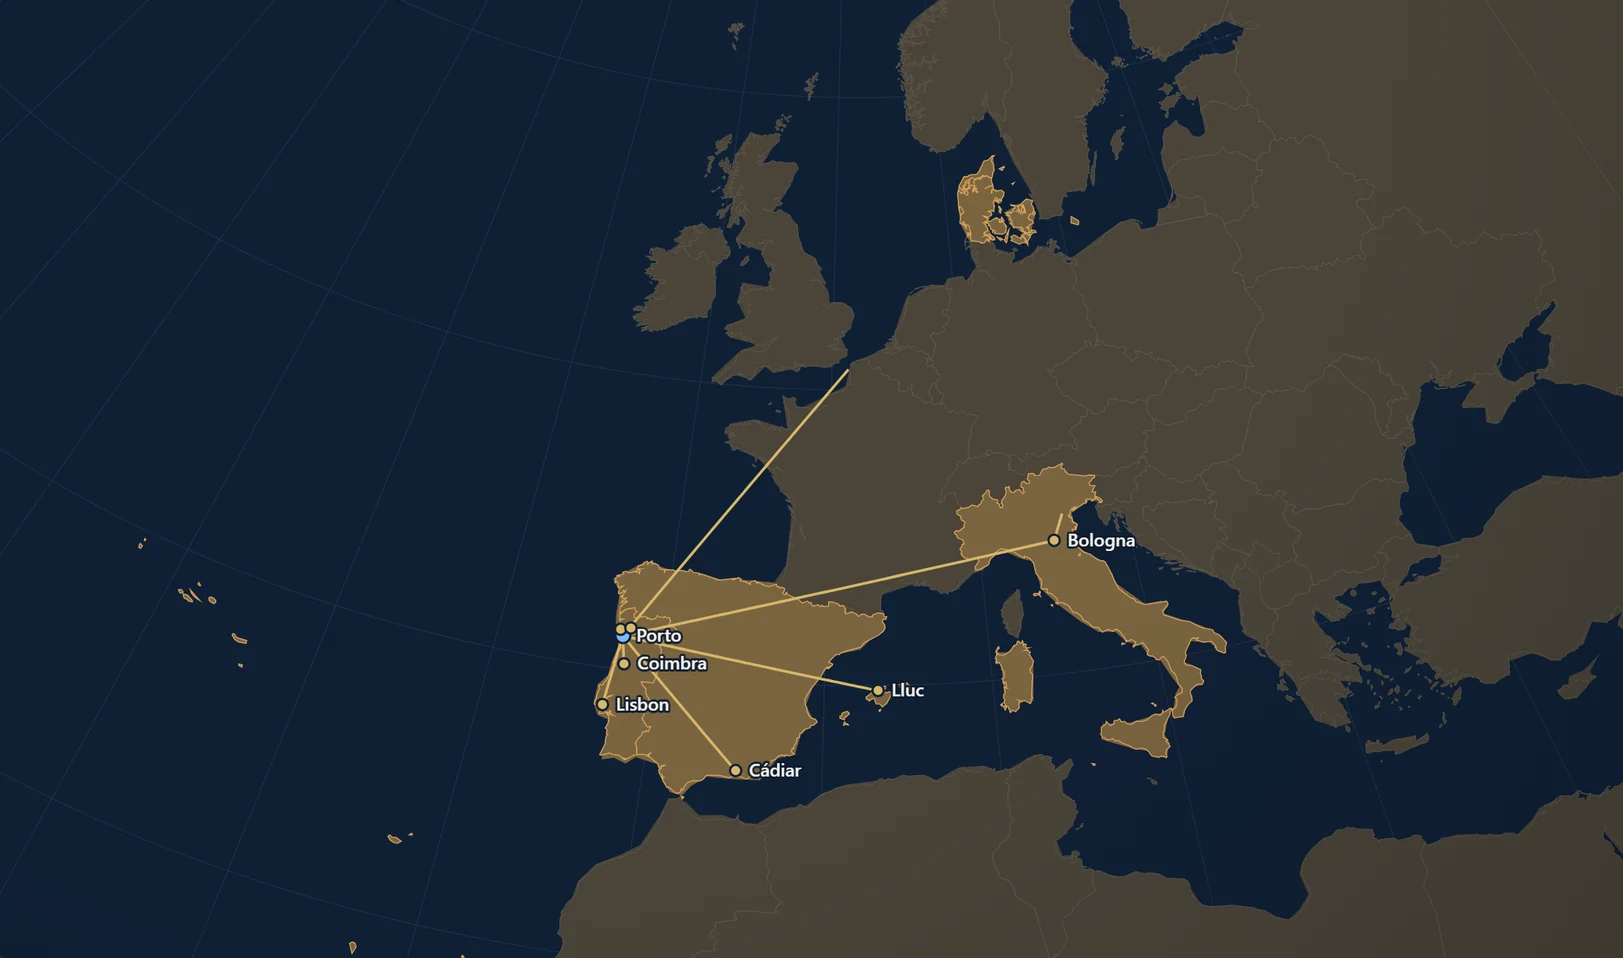
A globe with arcs from Porto to the places I have worked in, which you can drag, zoom and replay.
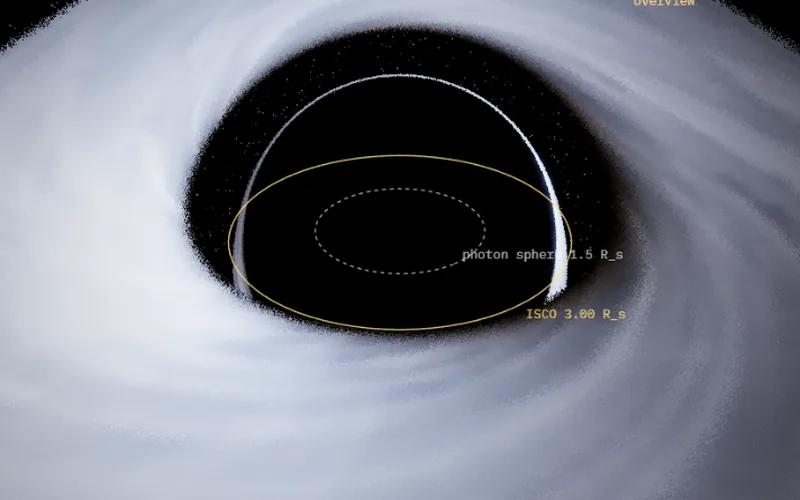
Interactive physics simulations in the browser, here a black hole with its photon sphere and innermost stable orbit marked.
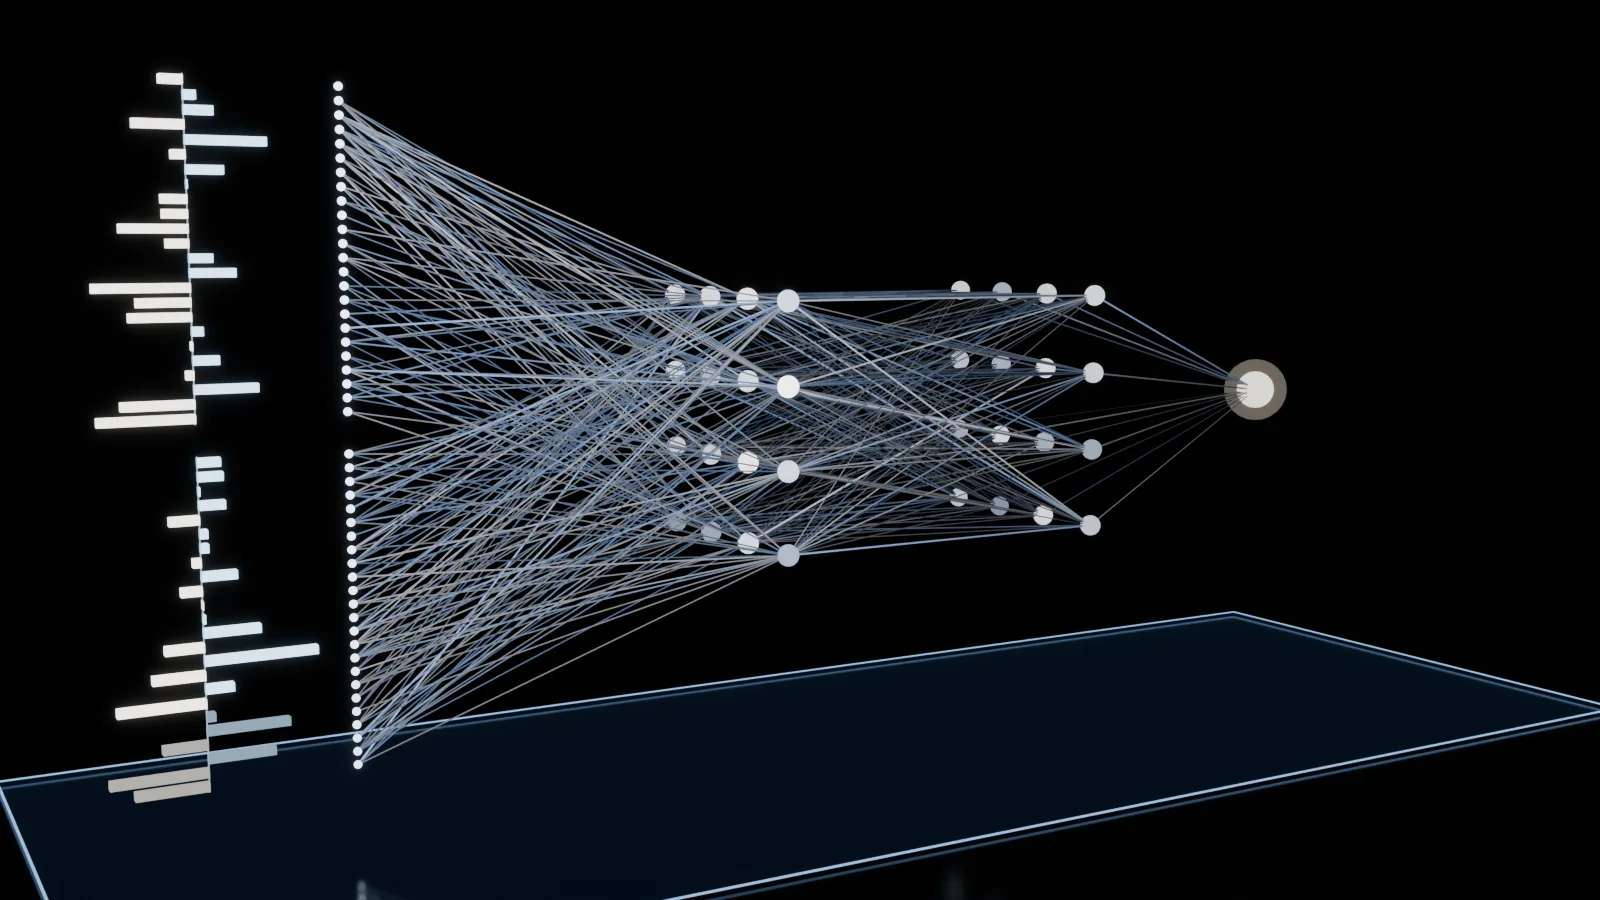
A network learns stellar metallicity live in the browser from real Gaia spectra of 4,000 stars.
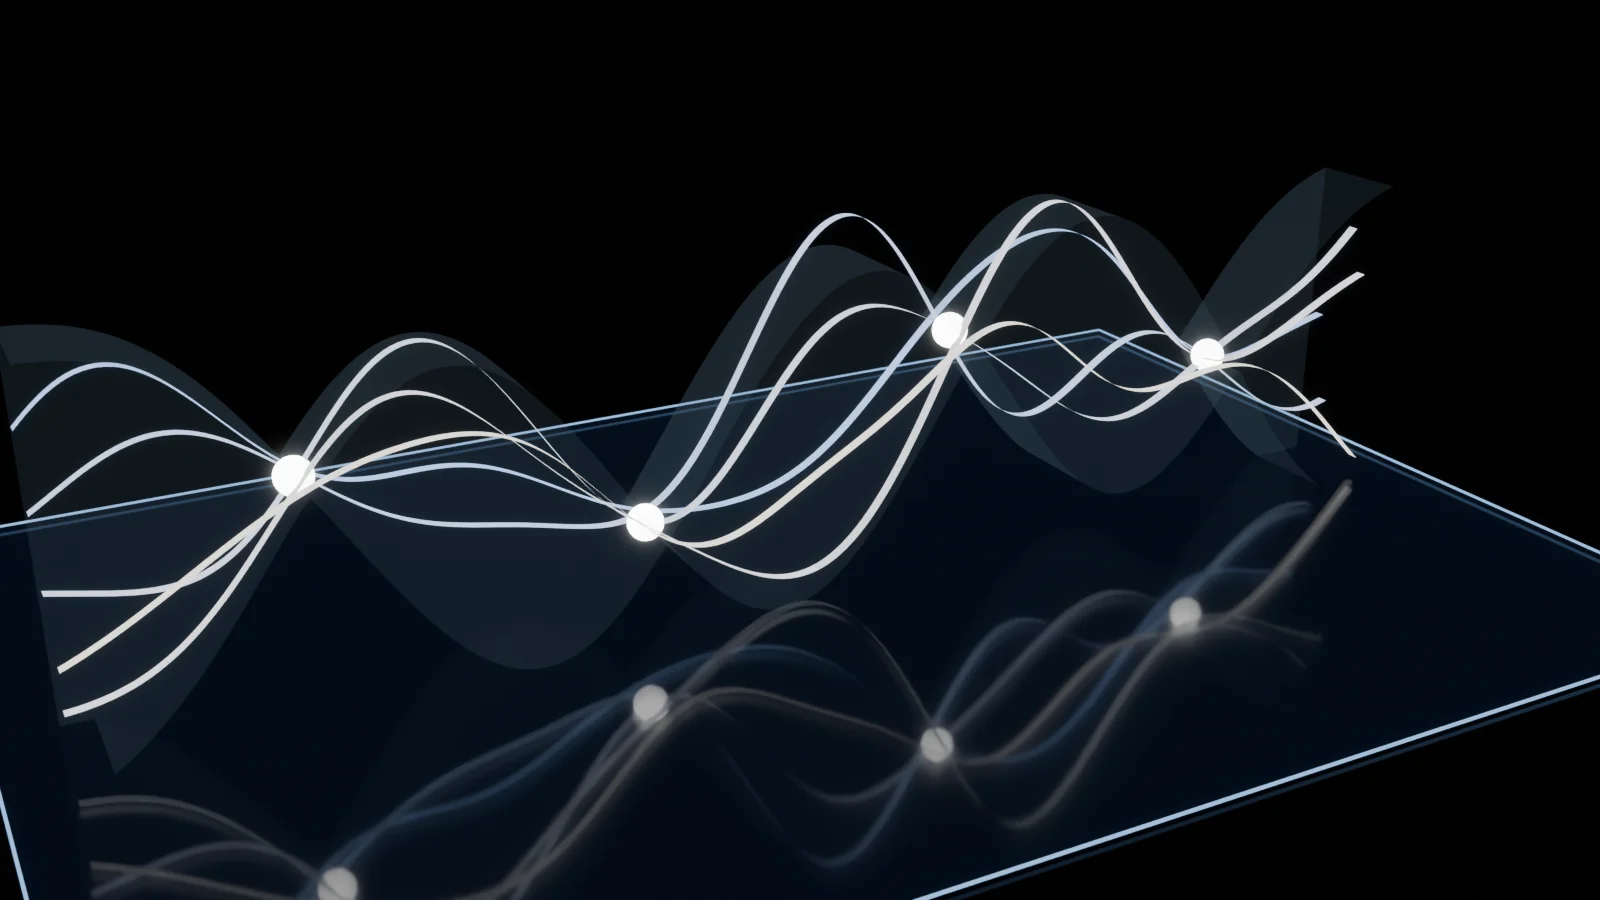
Random curves are pinned to observations, and the activity of HD 41248 is then modelled from 223 velocity measurements.
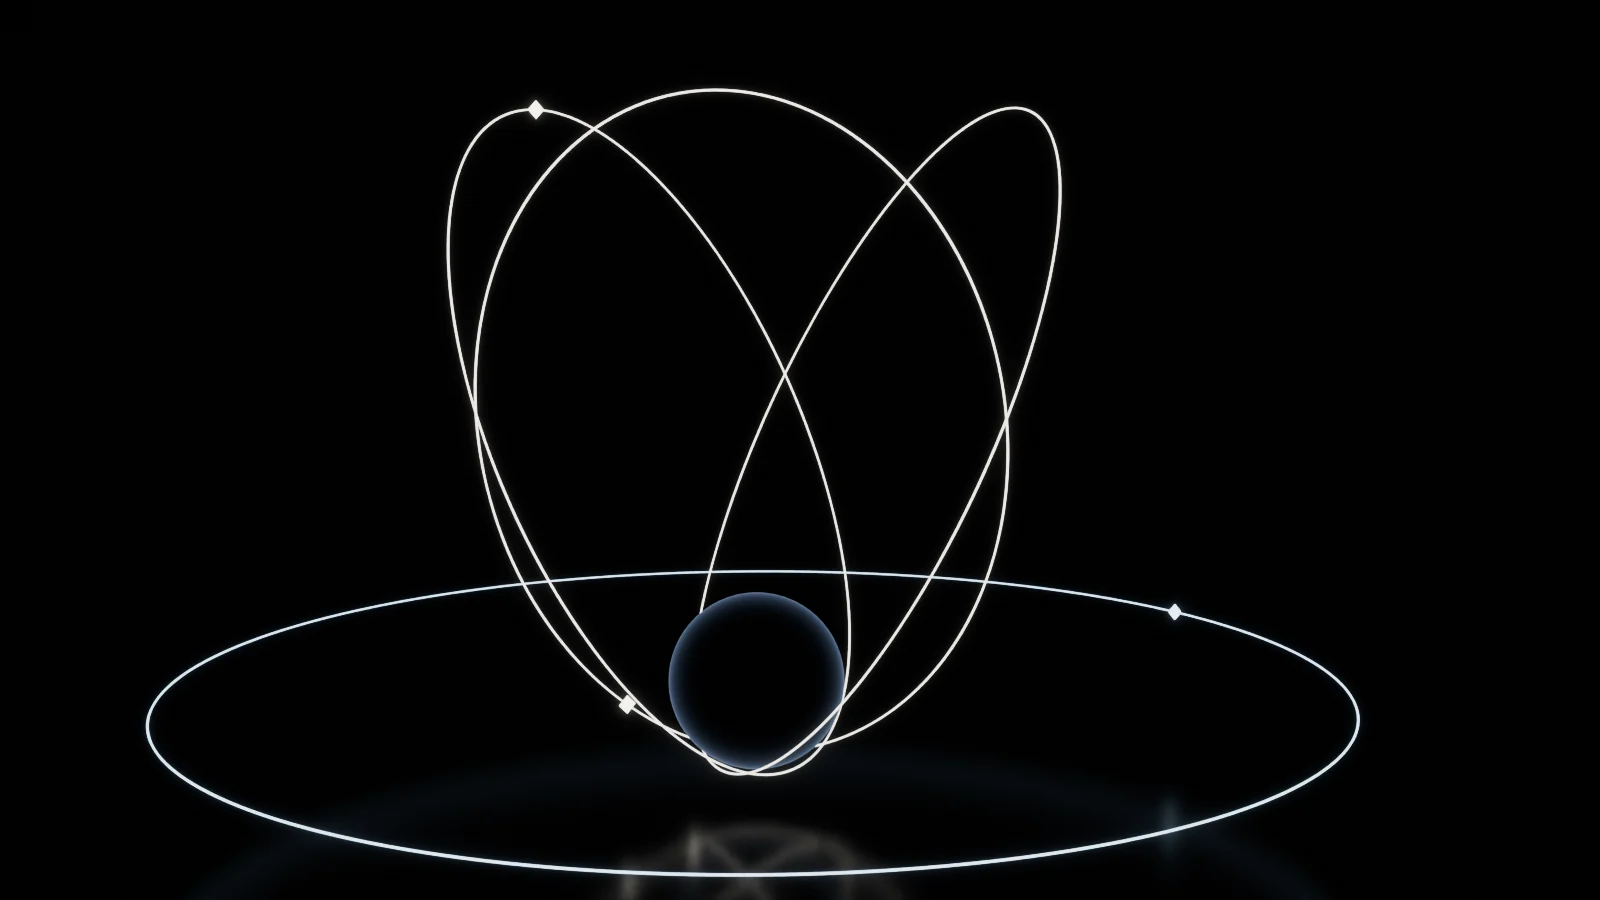
Three ways of integrating an orbit around the Earth are compared, then six Gaia stars are followed through the Galaxy.
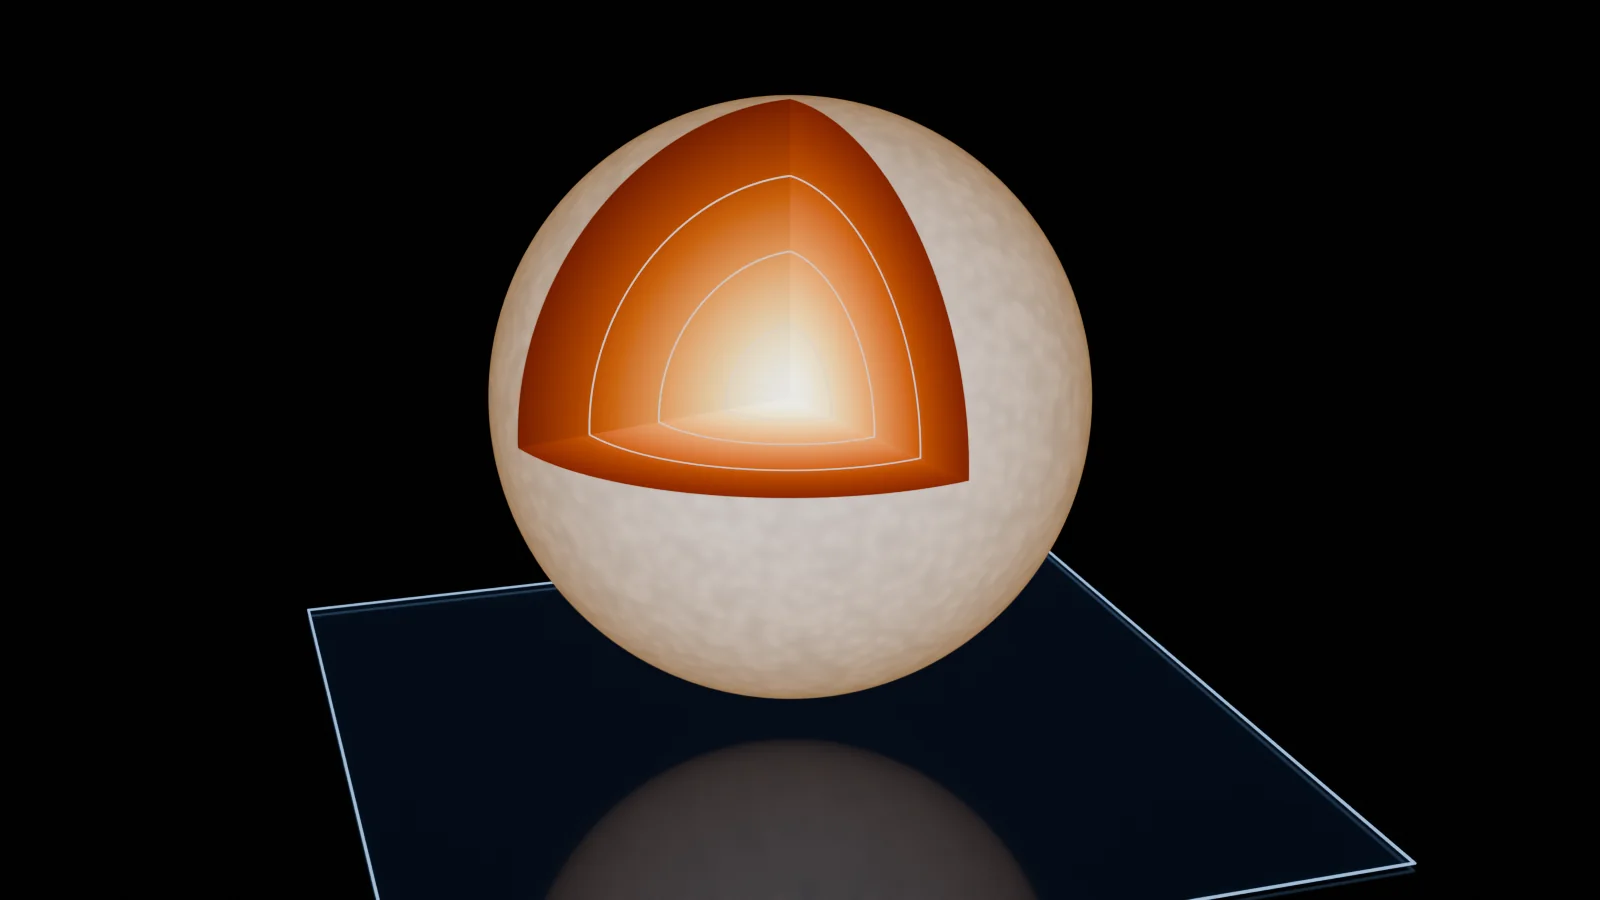
I solved the Lane-Emden equation, scaled it to a real star and marked where the simple model fails.