Your first run
This page runs Starfold in five lines on the scikit-learn digits dataset and shows you how to read the result. The dataset is a copy of the UCI handwritten digits test set: 1,797 images of 8 by 8 pixels, one per row, with 64 pixel columns.
Install first, in one line: pip install "starfold @ git+https://github.com/AndreasWNeitzel/starfold". The Install Starfold page has the virtual environment and the GPU options.
What you need
Starfold installed, Python 3.11 or 3.12.
scikit-learn, which Starfold already installs. It ships the digits dataset, so you download nothing.
About a minute and a half on a GPU. The recorded run took 93.9 s on a laptop RTX 3060 with cuML (search 77.4 s, refits 7.2 s). A CPU run is not measured here; expect it to take longer.
What the call does
starfold.recover runs the whole procedure in one call. It searches the settings of UMAP and HDBSCAN with Optuna and fits the winning setting on all rows. Then it refits that setting on 32 random subsets of 80 percent of the rows. Each of those fits is a refit. The refits show how much the groups change when the rows change. random_state=0 is the seed from which every random choice derives.
The last line of the code prints four things, in this order:
The flags: short names for weak evidence or notable events.
The number of groups in the fit on all rows.
The count interval: the range of group counts that the 32 refits found.
The unresolved mass: how often a row failed to stay with its group across refits.
Steps
Put these five lines in a file or a notebook cell.
import starfold
from sklearn.datasets import load_digits
X = load_digits().data
result = starfold.recover(X, random_state=0)
print(result.flags, result.n_groups, result.worlds.count_interval, f"{result.unresolved_mass:.3f}")
Run them. Nothing prints until the fit ends, and then one line appears:
('search_budget_exhausted', 'count_unstable', 'consensus_disagrees', 'null_not_run') 10 (3, 16) 0.044The numbers come from the recorded run (
notebooks/01_digits.ipynb, cuML engine,random_state=0). Another engine, machine or version can give other numbers, because the fits use random numbers and floating-point arithmetic. If yours differ a little, the reading below still holds. If the flags or the group count differ a lot, compare your versions and engine with the recorded ones: Reproduce a run.
What each code line does
import starfoldloads the package. It does not load UMAP until needed.load_digitsis scikit-learn’s table of 8 by 8 pixel images of handwritten digits..datakeeps the 1,797 rows and 64 columns of pixel values (0 to 16). The loader also returns the true digit of each image in.target, but the code passes only.data. Starfold never sees the digits.starfold.recoverdoes everything described above.printshows the four things listed above.
Read the printout
Read the flags first, then the group count, then the interval, then the unresolved mass.
Four flags are raised:
search_budget_exhaustedsays the search used all 48 trials. It only says how the search ended.count_unstablesays fewer than half of the refits found the same number of groups as the full fit. Do not quote a single group count.consensus_disagreessays a second check gave a different grouping. The check counts, for every pair of rows, how often the refits put them together (the co-association), and cuts the rows into groups from those counts. The cut matched your labels with a score of 0.135 (the adjusted Rand index times coverage), below the 0.5 threshold, and it found 3 groups. Do not treat this as an error. Pairs of rows inside one group were together in 0.820 of the refits and pairs in different groups in 0.068. That gap, 0.751, is the contrast. On average, the refits keep pairs inside your groups together and pairs across groups apart. It is an average over all pairs, so it does not show that every group holds, nor that the groups are real. The Refits: reproducibility, not truth page explains co-association.null_not_runsays the optional calibration test did not run, so there is no p-value. It is expected, because the test is off by default.
10 is the number of groups in the full fit. Thirty of the 1,797 rows are noise (label -1): no clump claimed them. Noise is not a bad measurement.
(3, 16) is the 5th to 95th percentile of the number of groups the 32 refits found, rounded outward to whole numbers. It is a stability interval, not a confidence interval. A wide interval, as here, says the count changes with the rows drawn. Do not quote 10 as the number of digit classes on this evidence. The count is not a finding.
0.044 is the average share of refit outcomes in which a row was left unresolved. Moving to another group does not count. A row counts as unresolved in one refit when that refit called it noise, or placed it with rows the full fit calls noise. Zero would mean no refit calls any row noise or groups it with full-fit noise rows. Above 0.5 the flag high_unresolved_mass is raised: on average, most refit outcomes leave a row unresolved. At 0.044 it is low, so read the other numbers as usual.
The printout does not show which groups come back, but the recorded run also gives each group a recurrence. Two groups (0 and 1) come back with recurrence 1.00. The other eight come back only in part, between 0.45 and 0.84. Use the high-recurrence groups first. The Tutorials page reads every group.
Look at the groups
The recorded notebook draws the groups on a two-dimensional picture, made by a separate UMAP fit for display. You do not need the figure for the rest of the page.
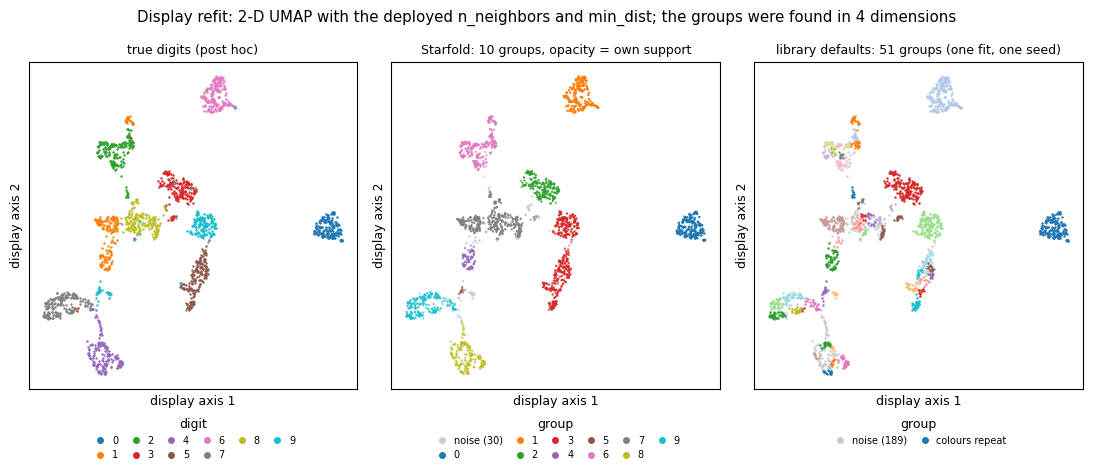
The left panel colours each image by its true digit, which Starfold never used. The middle panel colours the same images by Starfold’s group. A faded point is a row with low own support: the refits rarely put that row back with its group. Own support runs from 0 to 1 and is not a probability or a purity. Grey points are the 30 noise rows. The right panel shows one fit of the library defaults on all rows (recorded run, random_state=0), which cuts the same map into 51 groups and 189 noise rows.
Compare the middle panel with the left panel, then with the right panel. The defaults split the map into many small pieces, while Starfold’s ten groups follow the islands more closely. Trust the solid-coloured groups first, and check the faded ones against their recurrence before you use them.
The display map is drawn by a separate UMAP fit. Distances between islands on it are not the ones HDBSCAN used, so do not read the gaps or sizes as measurements.
What you learned
One call gives labels, refit evidence and flags.
Flags come first. Not every flag is a fault.
A stable count is not a true count, and the interval here shows the count is not stable.
Some groups recur fully (groups 0 and 1) and others only in part, so name the groups when you describe the result.
Next steps
Follow the full digits example, with every output explained: Tutorials.
Understand what happened inside
recover: Concepts.Look up a printed number: Metrics.
Use your own table: How-to guides.