Group properties and their bands
This page explains the group medians and bands, the per-group, per-column numbers that say where a group sits and how far that position moves across refits.
The question it answers
What is the typical value of each column in each group, and does that value move when you fit again on random subsets?
In each refit, Starfold matches every group of the full fit to the refit group with the highest Jaccard index (the best match, as in Group recurrence). It takes the median of each column over the matched refit group. The page’s two numbers per group and column are the median of those medians over refits, and their 5th to 95th percentile. Both are in the original units of the column.
A picture
Take one group with 32 refits (toy numbers). The refits give a median of [Fe/H] between minus 0.43 and minus 0.40. The median of the 32 medians is minus 0.42 and the band runs from minus 0.43 to minus 0.40. The band is narrow because the refit medians barely move.
The recorded run on the APOGEE DR19 example table shows this for eight columns. The right panel below gives each group’s median minus the table mean, in units of the table’s standard deviation. The bars are the bands. The recorded runs quoted on this page ship in the repository under notebooks/runs/digits and notebooks/runs/apogee. Notebooks 01 and 02 write them, and starfold.load reads them.
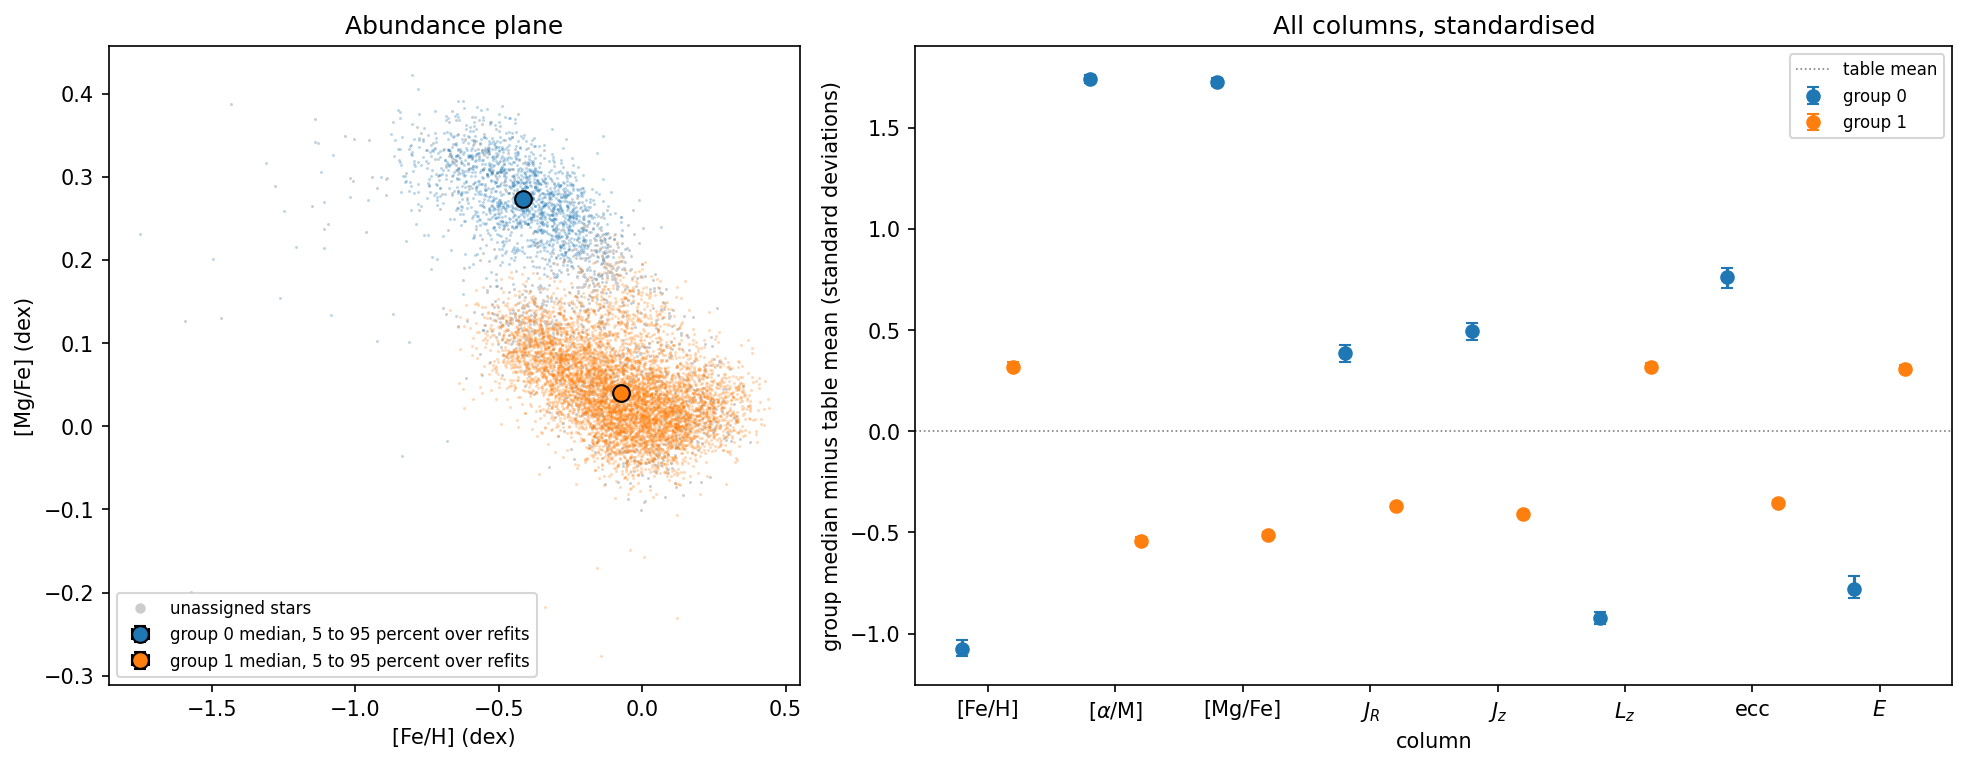
Look at the right panel. The two groups differ by more than a unit of standard deviation in [Fe/H], [alpha/M] and [Mg/Fe]. The bars are smaller than the dots, so these medians barely move across refits.
Range and reference values
Range: the range of the column, in its own unit.
Perfect result: a band of width 0. The median does not move across refits.
Pure chance: not applicable.
A group never matched by a refit with Jaccard above 0 has NaN in its row.
How to read a value
The range is the movement of the median under resampling. It is not the width of the group. Compare the band with the distance between group medians. The bands are a rule of thumb from this project, not from a published source.
Band against the gap between group medians |
Reading |
Decision |
|---|---|---|
Much smaller than the gap |
The groups differ in this column beyond resampling |
Describe the difference |
About as large as the gap |
The column does not separate the groups reliably |
Do not use it to describe them |
Larger than the gap |
The median is not stable |
Do not report a value for this column |
What misleads
The range is not the spread of the group. A group that is wide in [Fe/H] can still have a narrow band, because its median moves little.
A band from resampling holds no measurement error unless you pass
X_error a sampler. Theproperty_propagatedattribute says whether measurement draws entered. The recorded runs had no per-value errors, so their bands come from subsampling and seeds only.The bands are stability intervals, not confidence interval bounds. They do not cover a true population median.
The match uses the best Jaccard refit group. If a group recurs poorly, its band mixes different refit groups. Read Group recurrence first.
Where Starfold prints it
The attributes are result.worlds.property_median (shape groups by columns), result.worlds.property_band (shape groups by columns by 2) and result.worlds.property_propagated. The notebook notebooks/02_apogee.ipynb printed the recorded lines below. These lines run inside the notebook, where worlds, kept, groups, names, fmt, UNITS and np are already defined. fmt gives three significant figures.
median, band = worlds.property_median, worlds.property_band
overall = np.median(kept, axis=0)
for i, g in enumerate(groups):
    print(f"group {g}: median over refits (5 to 95 percent), then all stars")
    for j, name in enumerate(names):
        print(
            f"  {name:8}{fmt(median[i, j]):>9} ({fmt(band[i, j, 0])} to {fmt(band[i, j, 1])})"
            f"{fmt(overall[j]):>11}  {UNITS[name]}"
        )
For group 0, with 32 refits and no per-star errors, the first three columns read:
group 0: median over refits (5 to 95 percent), then all stars
  fe_h       -0.416 (-0.424 to -0.405)     -0.138  dex
  alpha_m     0.222 (0.221 to 0.224)     0.0448  dex
  mg_fe       0.273 (0.271 to 0.275)     0.0618  dex
The last column is the median of all stars. Group 0 has a median [Fe/H] of minus 0.416 dex with a band of minus 0.424 to minus 0.405, about 0.02 dex wide. The recorded digits run (notebooks/01_digits.ipynb) printed median width of the property bands: 1.00 pixel units.
Formula
For group \(g\) and column \(j\), let \(m_{wj}\) be the median of column \(j\) over the refit cluster that best matches \(g\) in refit \(w\). It uses the refit’s own feature values (after the measurement draw, if any). Refits with best Jaccard 0 are skipped. Then
with linear-interpolated percentiles.
Learn more
Matching groups across resamples: Hennig (2007), doi:10.1016/j.csda.2006.11.025.
Percentiles with linear interpolation: numpy.percentile.
Glossary: stability interval, confidence interval, refit. Related pages: Group recurrence, Count interval.