Plot your result
This guide points at the plotting cells of the notebooks, names the attribute each plot reads, and shows how to read two of them. The notebooks hold the full code, so this page does not repeat it.
Prerequisites
A result from
starfold.recover, or one loaded with Save a result and load it back.A clone of the repository, with
uv sync --extra bench, so that you can opennotebooks/01_digits.ipynb.matplotlib. Every plot below needs only that and the result. Plots marked post hoc also need known labels (Check a result against known labels).
Steps
Open
notebooks/01_digits.ipynb. Its first cell finds the repository root and its parameters cell setsRANDOM_STATE,ENGINE,N_JOBSandFIGURES. SetFIGURESto a folder to save each figure as it is drawn.Replace the data cell and the
recovercell with your own table and result. Every plotting cell after them reads only fromresult.Run the plotting cells in the order below. Each row names the heading of the cell in
notebooks/01_digits.ipynband what it reads.Heading of the cell
Reads
Shows
A picture of the groups
result.labels,result.worlds.own_support,result.default_labelsthe rows on a 2-D map, in three panels: known classes (post hoc), Starfold, library defaults
Settings against groups
result.search.trials, each trial’sscore,fit_countsandphasethe score of every complete trial against the groups it found
Support per row
result.worlds.own_support,result.worlds.unresolvedhow reliably each grouped row comes back
Recurrence per group
result.worlds.group_recurrenceandgroup_recurrence_bandhow often each group comes back, and the group sizes
How many groups
result.worlds.count_valuesandcount_intervalthe groups found in each refit
The co-association check
result.consensuswithin-group, between-group and contrast values
The notebook draws the map in 2-D by fitting UMAP again with the chosen
n_neighborsandmin_dist. If the chosen map has more than two coordinates, the picture is a separate 2-D display map and not the space in which the groups were found.Save the figures as PDF if they are for a paper. The notebook writes PNG at 150 dpi for the manual. Change the extension and the
savefigcall insave_figure.For the structureless copies and the calibration histograms, use
notebooks/03_calibration.ipynb(starfold.generate_null(x, family, seed=0)makes a copy). For physical units of the groups, use the cell “The groups in physical units” innotebooks/02_apogee.ipynb, which readsresult.worlds.property_medianandproperty_band.
Reading two plots
Groups found in each refit
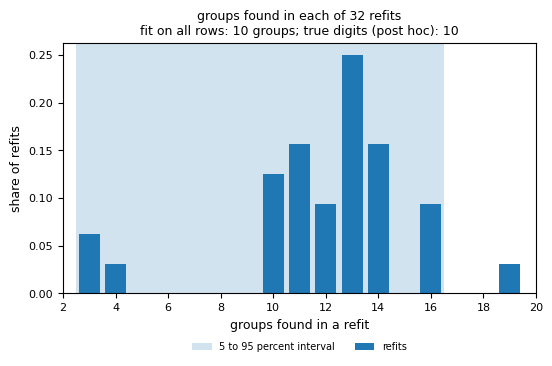
The bars show how many refits found each group count. Most of the mass lies between 10 and 14 groups, and a few refits found 3, 4 or 19. The shaded band is the stability interval, 3 to 16. The fit on all rows has 10 groups, and only about one refit in eight (4 of 32) found exactly 10. Quote the interval and not the single count. This run raises count_unstable, which means fewer than half the refits found the same count as the fit on all rows. The count is not an estimate of how many populations exist (count interval).
Recurrence of each group
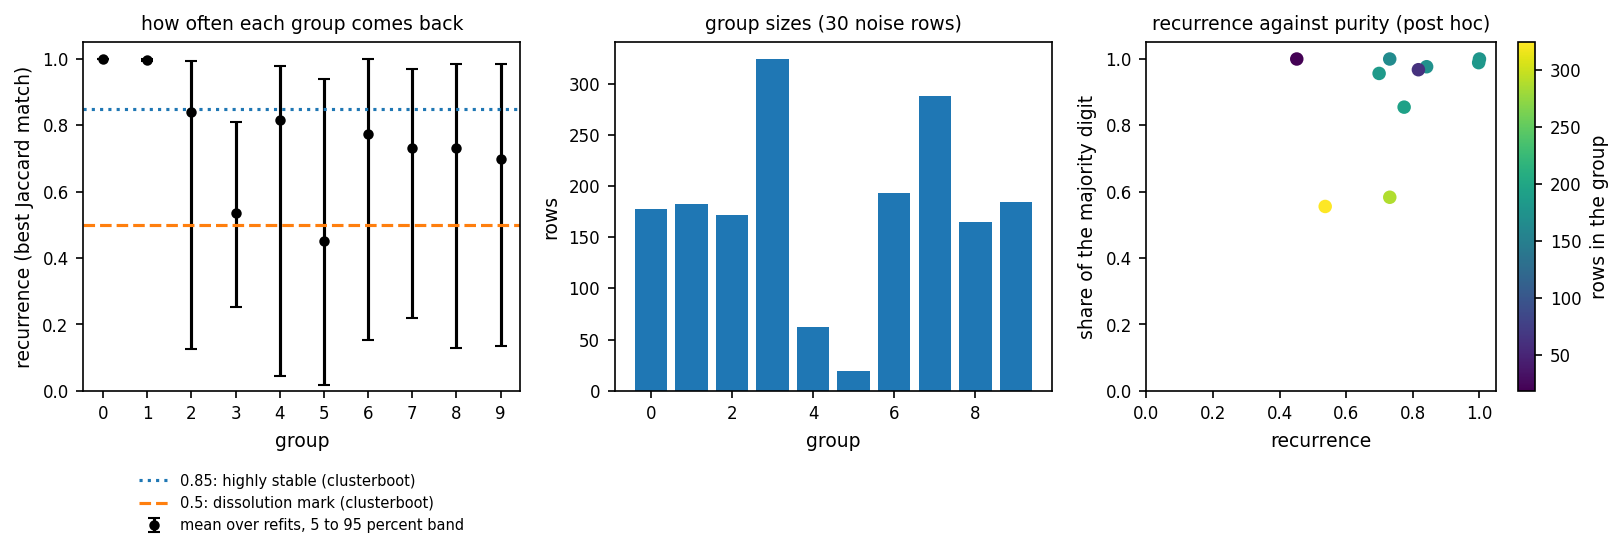
The left panel shows one dot per group, with a band over refits. Groups 0 and 1 sit at 1.00 with no visible band, so they come back in almost every refit. Group 5, the smallest (19 rows), has the lowest value, 0.45 (band 0.02 to 0.94), and group 3 has 0.54 (0.25 to 0.81). The other six lie between 0.70 and 0.84, with wide bands whose lower ends run from 0.05 to 0.22. The dotted line at 0.85 and the dashed line at 0.5 are the clusterboot marks (R package fpc) for a highly stable mean and for a cluster that dissolved in one resample. Starfold quotes them and never uses them to drop a group. Describe groups 0 and 1 as reproducible and treat the wide-band groups as uncertain. Read the right panel (post hoc) before you say anything about what a group is. Recurrence is how often a group comes back across refits, not a probability. See Group recurrence.
Expected result
You get five figures and one printed check for your result. Read each figure axis by axis and say what it lets you report, as in the two readings above. The Digits notebook reproduces the figures of this manual from the recorded run in notebooks/runs/digits. The saved runs in notebooks/runs/ ship with the repository, and notebooks 01 and 02 write them.
Variations
Replot without refitting. Load the saved result with
starfold.load("notebooks/runs/digits")and run only the plotting cells.Your own figure. Every array the notebooks plot is an attribute listed in Saved result files.