Group recurrence
This page explains group recurrence, the number that says how often a group of the full fit comes back when the rows are resampled.
The question it answers
When you fit again on a random 80 percent of the rows, does a group with the same members come back?
Starfold calls each such fit a refit. The fit on all rows is the full fit. Recurrence is the mean, over refits, of how closely the best-matching refit group resembles one group of the full fit.
A picture
The Jaccard index compares two sets of rows. Divide the rows they share by the rows in either set. Identical sets score 1. Sets with no shared row score 0.
Take a toy group of four rows in the full fit: a, b, c, d.
full-fit group   : a b c d
refit group A    : a b c d          shared 4, in either 4  ->  4/4 = 1.00
refit group B    : a b c e          shared 3, in either 5  ->  3/5 = 0.60
refit group C    : d x y z          shared 1, in either 7  ->  1/7 = 0.14
In each refit, Starfold picks the refit group with the highest Jaccard index against the group and keeps that number. A group that scores 1.00 in every refit has recurrence 1. A group that refits keep splitting or dissolving scores low.
The recorded runs quoted on this page ship in the repository under notebooks/runs/digits and notebooks/runs/apogee. Notebooks 01 and 02 write them, and starfold.load reads them. The left panel below shows the recorded run on the scikit-learn digits dataset. Each dot is the mean over 32 refits. Each bar is the 5th to 95th percentile over refits. The dotted line sits at 0.85 and the dashed line at 0.5, the two clusterboot marks described below.
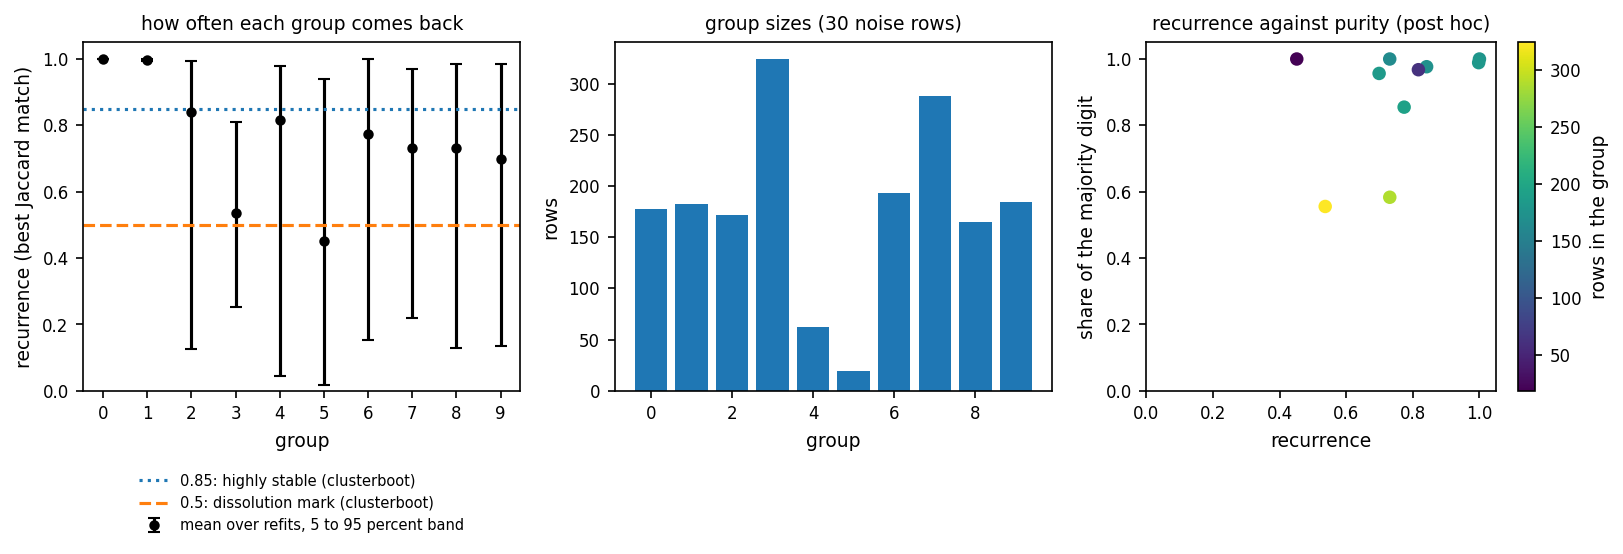
Look at groups 0 and 1 (dots at 1.00, no visible bar) against group 5 (dot at 0.45, bar from 0.02 to 0.94). Groups 0 and 1 are reproducible. Group 5 has 19 rows and often dissolves, so report it as fragile. The right panel plots recurrence against purity, the share of a group’s rows that show the group’s most common true digit. Purity is a post hoc check, made against labels that Starfold never read. The bars are percentiles: the 5th percentile is the value that 5 percent of the refits fall below.
Range and reference values
Range: 0 to 1.
Perfect result: 1. In every refit, the best-matching cluster holds exactly the group’s members that the refit drew.
Pure chance: not applicable. A group of any size can score low without chance being the cause, and no value marks “random”.
How to read a value
Hennig (2007) proposes the mean Jaccard over resamples as the stability measure of a cluster, but gives no cutoff on that mean. The readings in the table come from the help page of the R function clusterboot (Hennig, R package fpc, clusterboot help). The help page calls them rough guidelines for its own bootstrap scheme. Starfold resamples in its own way, so read them as rough marks. It also warns that stability alone does not show that a cluster is valid. Starfold never uses these marks as filters and never removes a group. The decision column is advice from this manual, not from a published source.
Recurrence |
Reading ( |
Decision |
|---|---|---|
0.85 or more |
Highly stable |
Describe the group as reproducible. |
0.75 to 0.85 |
Valid and stable |
Describe the group as stable under resampling, and give its band. |
0.6 to 0.75 |
Shows a pattern, but which rows belong is doubtful |
Treat the group as tentative, and follow the steps below. |
Below 0.6 |
Should not be trusted |
Do not describe the group as a finding. Follow the steps below. |
The help page states the 0.5 mark for a single resample: a Jaccard of 0.5 or less there means the cluster dissolved. In Starfold it applies to the value of one refit, so read it against the lower end of the band. A mean below 0.5 matches the dissolution mark, but the mark itself is about one refit.
If your value is below 0.75
Take group 3 of the recorded digits run: recurrence 0.54, band 0.25 to 0.81, 324 rows. The mean is below 0.6, so the clusterboot guidelines say not to trust it. The lower end of the band is below 0.5, so by the dissolution mark some refits lost the group. The group is large, so the small-group caution below does not explain it. This reading is the manual’s own; no published source gives it.
Read the band. If its lower end is below 0.5, say that some refits lost the group.
Find which group it merges with. Average the support of the group’s rows over the other groups. A second group with a large average means the refits move rows between the two. The Co-association, contrast and the consensus check page explains the within and between values that the same refits give.
Do not report the group as a stable population. Report its value and band.
Test it with more refits (
Config(n_worlds=...)) or a different seed. If the value stays below 0.75, keep the group tentative. If it moves between bands, the estimate itself is not settled.
rows = result.labels == 3
print(result.support[rows].mean(axis=0).round(2))
The output depends on the table. The code runs after a recover call, where result exists.
What misleads
A stable group is not a true group. Recurrence measures reproducibility under resampling only.
The mean can hide a wide band. In the digits record, group 2 has a mean of 0.84 and a band from 0.12 to 0.99. Read the band with the mean.
Small groups move more. One row more or less changes the Jaccard index of a 19-row group much more than that of a 324-row group.
Recurrence is computed over refits of 80 percent of the rows. It says nothing about rows that are absent from the table, such as a missing selection.
Where Starfold prints it
The attributes are result.worlds.group_recurrence (one value per group) and result.worlds.group_recurrence_band (5th and 95th percentile per group). The notebook notebooks/01_digits.ipynb printed the recorded run below. These lines run inside the notebook, where w and sizes (the group sizes) are already defined.
w = result.worlds
for group, (recurrence, (low, high), size) in enumerate(
    zip(w.group_recurrence, w.group_recurrence_band, sizes, strict=True)
):
    print(
        f"  group {group:2d}: {size:4d} rows, recurrence {recurrence:.2f} ({low:.2f} to {high:.2f})"
    )
The first four of the ten groups, from 32 refits, read:
  group  0:  178 rows, recurrence 1.00 (1.00 to 1.00)
  group  1:  182 rows, recurrence 1.00 (0.99 to 1.00)
  group  2:  172 rows, recurrence 0.84 (0.12 to 0.99)
  group  3:  324 rows, recurrence 0.54 (0.25 to 0.81)
The recorded run on the APOGEE DR19 example table (notebooks/02_apogee.ipynb) gave group 0 recurrence 0.914 (0.886 to 0.935) and group 1 recurrence 0.918 (0.879 to 0.938).
The band is a stability interval over refits. It is not a confidence interval. Refits that fail are counted as all noise, so they lower recurrence rather than being dropped.
Formula
Let \(G\) be a group of the full fit and \(W\) the set of refits that sampled at least one member of \(G\). For refit \(w\), let \(G_w\) be the members of \(G\) that the refit sampled and \(C_{wk}\) the \(k\)-th refit group. Then
A refit with no group scores 0. Ties go to the lowest refit group id. The band is the 5th and 95th percentile of the \(J_w\) with linear interpolation.
Learn more
Hennig (2007), cluster-wise assessment of cluster stability with Jaccard values: doi:10.1016/j.csda.2006.11.025. The paper proposes the mean Jaccard as the measure and gives no cutoff on it.
Hennig, fpc: Flexible Procedures for Clustering, R package, CRAN. The Details section of the clusterboot help page gives the 0.85, 0.75, 0.6 and 0.5 marks.
Jaccard index and other clustering comparisons in scikit-learn: clustering performance evaluation.
Glossary: Recurrence, Jaccard index, stability interval. Related pages: Support and own support, Count interval.